Sidebar
Who is online
We have 136 guests and no members online
Login
Select your language

")
Welcome! Nice, that you visit my site.
Have a look around! You may find some useful informations about my Joomla extensions and add-ons.- need to create charts with minimal effort?
- want to have informative tooltips within articles?
- are looking for another visitor counter?
- run you own Apps with Joomla
jphpx system Package
jphpx is a system package for custom codes in Joomla 3.9.x and Joomla 4.x. With jphpx, scripts in PHP, HTML and JavaScript can be integrated into module positions, articles, categories and user-defined modules from Joomla. Static HTML and Text pages can also be used. Full access to Joomla variables, functions and constants with PHP scripts is possible.

jsWeather
jsWeatheroffers a solution for preparing generally available weather data and displaying it in a user-friendly way. For this, the easy and safe to use weather application interface (API) from "OpenWeatherMap" is used.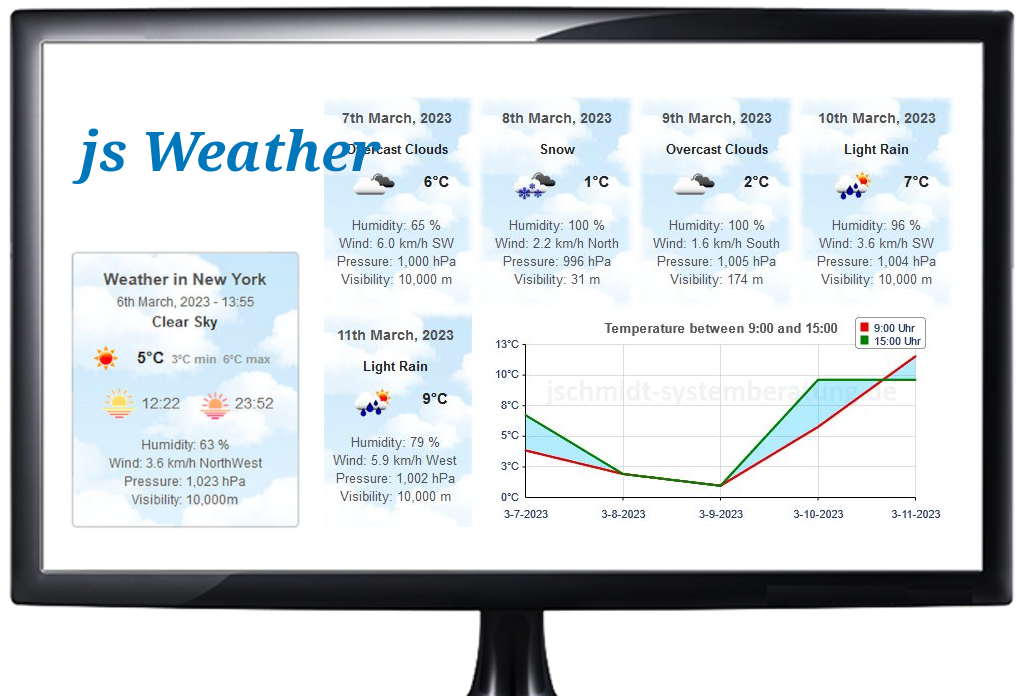
php-rgraph content plugin
php-rgraph is based on the popular charting API. RGraph. It incredibly eases creation of charts within your Joomla articles. With php-RGraph you get all the functions to retrieve and use data from mySql-databases, from local files, data from remote or local server, from csv-files and even from Google's sheets.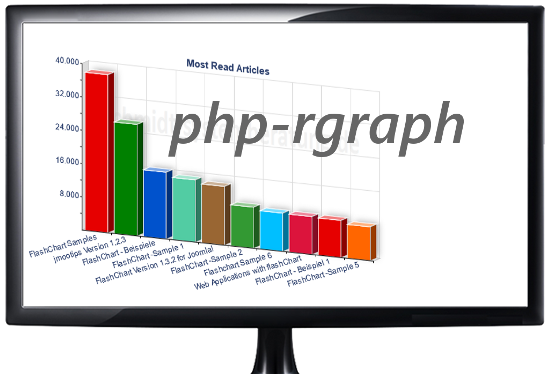
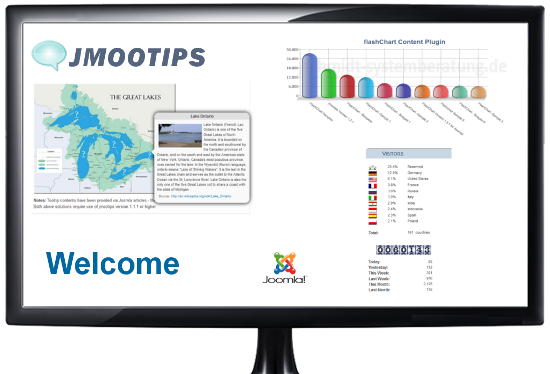
jmootips
Joomla Plugin jmootips may help to design Joomla articles and their informations to be more attractive and informative. With this plugin you are able to deploy tooltips very easily and fill tooltip content from various sources. Additionally you may control position and layout of tooltips almost without any programming skills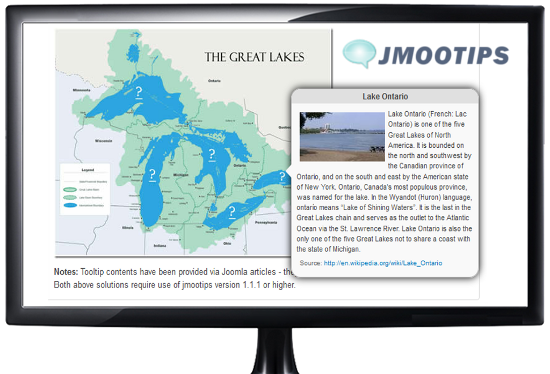
jsvisit Visitor Counter for Joomla
Do you like my visitor counter? This counter is a Joomla extension which not only counts your site's visitors but counts their countries as well. jsvisit is easy to install and to configure. The jsvisit Module provides 10 different Layouts for counters. These layouts may be customized or extended with own styling information for counters.
News about my Joomla Extensions

If you don't know what to talk about, then the topic of weather is always a good place to start. For this reason I have also dealt with the topic of weather and the result is the Joomla module jsWeather and a Web application for a weather forecast.
I have developed a new Joomla extension, jphpx, a system package for Joomla. jphpx consists of a system plugin, a Joomla component and a module for the use of custom codes in Joomla 4.x and Joomla 5.x. With jphpx, scripts in PHP, HTML and JavaScript can be integrated into module positions, articles, categories and user-defined modules from Joomla. Static HTML and Text pages can also be used. Full access to Joomla variables, functions and constants with PHP scripts is possible.
My Joomla extension, php-rgraph, a content plugin for Joomla is now supporting RGraph's Version 6.16. It uses my php-interface to the popular javascript api, RGraph, which is a JavaScript charts library that produces the charts dynamically with JavaScript and the HTML5 canvas tag. For more information read my articles about php-RGraph and my joomla plugin php-rgraph.
Also I encourage you to visit RGraph's home, to see the oustanding work the developers are doing and have done.
All my Joomla extension have been improved or have been added new or improved functions. Of course detected software bugs have been removed. In addition to that I've cleaned HTML-markups to adhere to HTML5 standards in all of my extensions. The interfaces to Joomla and Bootstrap have been improved and compatibility issues have been removed.
All my extension have been updated in order to be run with PHP Version 8.
jmootips Version 1.2.7 (Build 1.2.7.3) now uses bootstrap bundle version 5.1.3. The tipbutton editor-xtd plugin has been revised and thus improved for use with joomla version 4 and Version 5.
jmootips Version 1.2.6 implements the missing support for Bootstrap version 5. With this jmootips now also runs with full functionality under Joomla version 4.
jmootips Version 1.2.3 build level 1.2.3.0 introduces a new option, which allows jmootips to auto-adjust tooltip positions according to the displayed content. This parameter for auto positioning may be set via Joomla's admin backend or via jmootips plugin tags.
flashChart content plugin Since Adobe no longer supports Flash Player after December 31, 2020 and blocked Flash content from running in Flash Player beginning January 12, 2021, Adobe strongly recommends all users immediately uninstall Flash Player to help protect their systems. Therefore flashchart plugin will not run successfully anymore and is not supporteed anymore.
jsvisit counter 2.1.4 This Version has been tested and successfully run both with latest Joomla Version 4 and Version 5. With this version ip-addresses are assigend to countries, using a webservice from ip2c.org. If needed webservices from geoplugin.net and ip‑api.com or ipapi.co may also be used. The respective servers can be used all or selectively. If no server was selected, the assignment and counting of countries will be switched off.
Visitors
 30.9%
Germany
30.9%
Germany
 22.8%
USA
22.8%
USA
 3.3%
France
3.3%
France
 2.7%
Italy
2.7%
Italy
 2.1%
Indonesia
2.1%
Indonesia
 2.0%
Poland
2.0%
Poland
 1.8%
Netherlands
1.8%
Netherlands
Total:
209
Countries
Weather
Weather in Dublin

 |
46°F | 45°F min | 48°F max |
 |
6:46 |  |
20:15 |