Sidebar
Anmeldung
Forum - jschmidt-systemberatung.de
×
php-RGraph und php-rgraph Joomla Content Plugin
key border and tooltips not working in Joomla 4
- lukas hajek
-
 Autor
Autor
- Besucher
-

1 Jahr 11 Monate her #1310
von lukas hajek
key border and tooltips not working in Joomla 4 wurde erstellt von lukas hajek
Hello, I managed to almost everything i needed with this cool plugin. The only 2 things I cannot change. The first is keyLinewidth="0" I dont want that border, and other values are working, but zero not. The other problem is formating tooltips. I cannot change border, font or background color. I have tried with tooltipscss parametr but without success. Are these parameters working within Joomla plugin? Thank you very much for your advice, danke sehr.
Lukas
Lukas
Bitte Anmelden oder Registrieren um der Konversation beizutreten.
- jochen
-

- Offline
- Administrator
-

Weniger
Mehr
1 Jahr 11 Monate her - 1 Jahr 11 Monate her #1311
von jochen
jochen antwortete auf key border and tooltips not working in Joomla 4
hi,
will create default "1" - but you may use keyPositionGraphBoxed="0"- if you have the key in graph mode (ie a box), this controls whether it has a border.
To change tooltip-layout you may change "rgraph_tooltips" class in in file "../media/plg_content_rgraph/css/rgraph.css" or you create your own tooltips_class and specify it via plugin-parms (setting of "CSS class for Tooltips" in php_rgraph plugin). Then store in one of your system css-files.
keyLinewidth="0"
To change tooltip-layout you may change "rgraph_tooltips" class in in file "../media/plg_content_rgraph/css/rgraph.css" or you create your own tooltips_class and specify it via plugin-parms (setting of "CSS class for Tooltips" in php_rgraph plugin). Then store in one of your system css-files.
Letzte Änderung: 1 Jahr 11 Monate her von jochen.
Bitte Anmelden oder Registrieren um der Konversation beizutreten.
- lukas hajek
-
 Autor
Autor
- Besucher
-

1 Jahr 11 Monate her - 1 Jahr 11 Monate her #1314
von lukas hajek
lukas hajek antwortete auf key border and tooltips not working in Joomla 4
Dear Jochen,
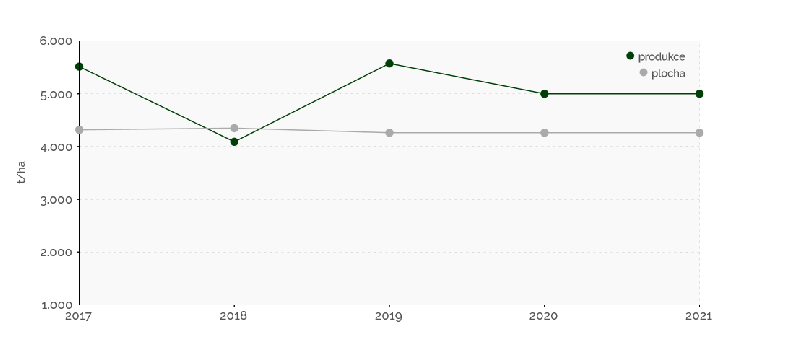
Thank you for your help. Everything is working fine. I have just two more questions. I have combined line graph - 2 lines. One line is green other grey. Is it possible that tooltip for green line will have green background (via css)? I have tried to add a class to this graph but it was not working.
The second question is, why tooltips on one graph work with onmousemove and on the other graph no. Thank you. This is my code:
and
Thank you for your help. Everything is working fine. I have just two more questions. I have combined line graph - 2 lines. One line is green other grey. Is it possible that tooltip for green line will have green background (via css)? I have tried to add a class to this graph but it was not working.
The second question is, why tooltips on one graph work with onmousemove and on the other graph no. Thank you. This is my code:
{rgraph type="Line" shadow="0" width="700" height="350"data="2017,2018,2019,2020,2021/5514,4090,5574,5000,5000"
tickmarksSize="4" tickmarksStyle="filledcircle" colors="#003f07" responsive="0.3,600,1000" backgroundGridDashed="1"
backgroundGridVlines="0" textSize="10" textFont="Raleway" title="" tooltip="#val# t" tooltipsEvent="mousemove"
yaxisTitle="t/ha" yaxisTitleOffsetx="-50" yaxisTitleFont="Raleway" yaxisScaleMin="1000" yaxisScaleMax="6000" key="produkce"
keyColorShape="circle" keyPositionGraphBoxed="0" keyLabelsSize="11" }cvs{/rgraph}
{rgraph type="Line" shadow="0" width="700" height="350"data="2017,2018,2019,2020,2021/4317,4349,4262,4262,4262"
tickmarksSize="4" tickmarksStyle="filledcircle" colors="#aaaaaa" responsive="0.3,600,1000" backgroundGridDashed="1"
backgroundGridVlines="0" textSize="10" textFont="Raleway" title="" tooltip="#val# ha" tooltipsEvent="mousemove"
yaxisScaleMin="1000" yaxisScaleMax="6000" combine_chart="1" key="plocha" keyPositionY="78" keyColorShape="circle"
keyPositionGraphBoxed="0" keyLabelsSize="11"}cvs{/rgraph}
Letzte Änderung: 1 Jahr 11 Monate her von jochen.
Bitte Anmelden oder Registrieren um der Konversation beizutreten.
- jochen
-

- Offline
- Administrator
-

1 Jahr 11 Monate her - 1 Jahr 10 Monate her #1315
von jochen
jochen antwortete auf key border and tooltips not working in Joomla 4
hi,
to use a different tooltip layout on your second chart, create a new tooltip class like this:
then define the use of this with parameter "tooltipsCssClass" on your second chart:
Ensure that new tooltip css-class is accessible (e.g.reload of css-files are successful)
If you combine charts, it seems that the events of first chart are defaulted (for tooltips this is "click"). You may ask developer of RGraph at www.rgraph.net/forum/index.html to explain this behaviour.
Interesting is, that if you omit the key-parameter on second chart, then "mousemove" works on both charts,.
to use a different tooltip layout on your second chart, create a new tooltip class like this:
.rgraph_tooltips_green {
color: #fff !important;
background-color: green !important;
padding: 4px !important;
border: solid 2px #707070 !important;
text-align: center;
z-index: 999 !important;
}
tooltipsCssClass="rgraph_tooltips_green"
If you combine charts, it seems that the events of first chart are defaulted (for tooltips this is "click"). You may ask developer of RGraph at www.rgraph.net/forum/index.html to explain this behaviour.
Interesting is, that if you omit the key-parameter on second chart, then "mousemove" works on both charts,.
Letzte Änderung: 1 Jahr 10 Monate her von jochen.
Folgende Benutzer bedankten sich: lukas hajek
Bitte Anmelden oder Registrieren um der Konversation beizutreten.
- lukas hajek
-
 Autor
Autor
- Besucher
-

1 Jahr 11 Monate her #1316
von lukas hajek
lukas hajek antwortete auf key border and tooltips not working in Joomla 4
Thank you so much, everythig working fine for me. That onmousemove bug is not that important. Danke sehr.
Bitte Anmelden oder Registrieren um der Konversation beizutreten.
Ladezeit der Seite: 0.279 Sekunden


