
")


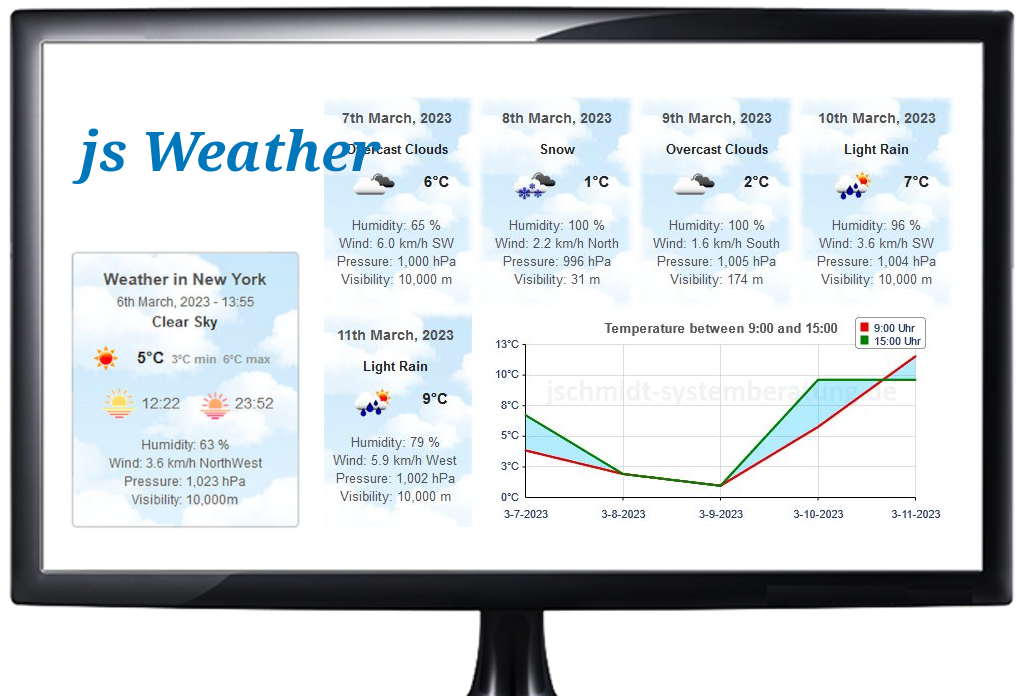


A line chart or line graph is a type of graph, which displays information as a series of data points connected by straight line segments. It is a basic type of chart common in many fields. It is an extension of a scatter graph, and is created by connecting a series of points that represent individual measurements with line segments. A line chart is often used to visualize a trend in data over intervals of time – a time series – thus the line is often drawn chronologically.
![]() With following reference you will have an overview about and see all supported line charts. All titles of charts are related directly to the "type-tag" (type="type-of chart") of flashChart.
With following reference you will have an overview about and see all supported line charts. All titles of charts are related directly to the "type-tag" (type="type-of chart") of flashChart.
|
{flashchart height="200" data="Jan,Feb,Mar,Apr,May/20,30,25,40,35|10,20,22,30,25" title="line" type="line" t_fontsize="12" axis_3d="0" y_step="10" legend_fontsize="12"}line01{/flashchart} |
{flashchart height="200" data="Jan,Feb,Mar,Apr,May/20,30,25,40,35|10,20,22,30,25" title="line_dotted" t_fontsize="12" type="line_dotted" axis_3d="0" y_step="10" legend_fontsize="12"}line02{/flashchart} |
|
{flashchart height="200" data="Jan,Feb,Mar,Apr,May/20,30,25,40,35|10,20,22,30,25" title="line_hollow" t_fontsize="12" type="line_hollow" axis_3d="0" y_step="10" legend_fontsize="12"}line03{/flashchart} |
{flashchart height="200" data="Jan,Feb,Mar,Apr,May/20,30,25,40,35|10,20,22,30,25" title="line_star" type="line_star" t_fontsize="12" axis_3d="0" y_step="10" legend_fontsize="12"}line04{/flashchart} |
|
{flashchart height="200" data="Jan,Feb,Mar,Apr,May/20,30,25,40,35|10,20,22,30,25" title="line_bow" t_fontsize="12" type="line_bow" axis_3d="0" y_step="10" legend_fontsize="12"}line05{/flashchart} |


